misp-grafana
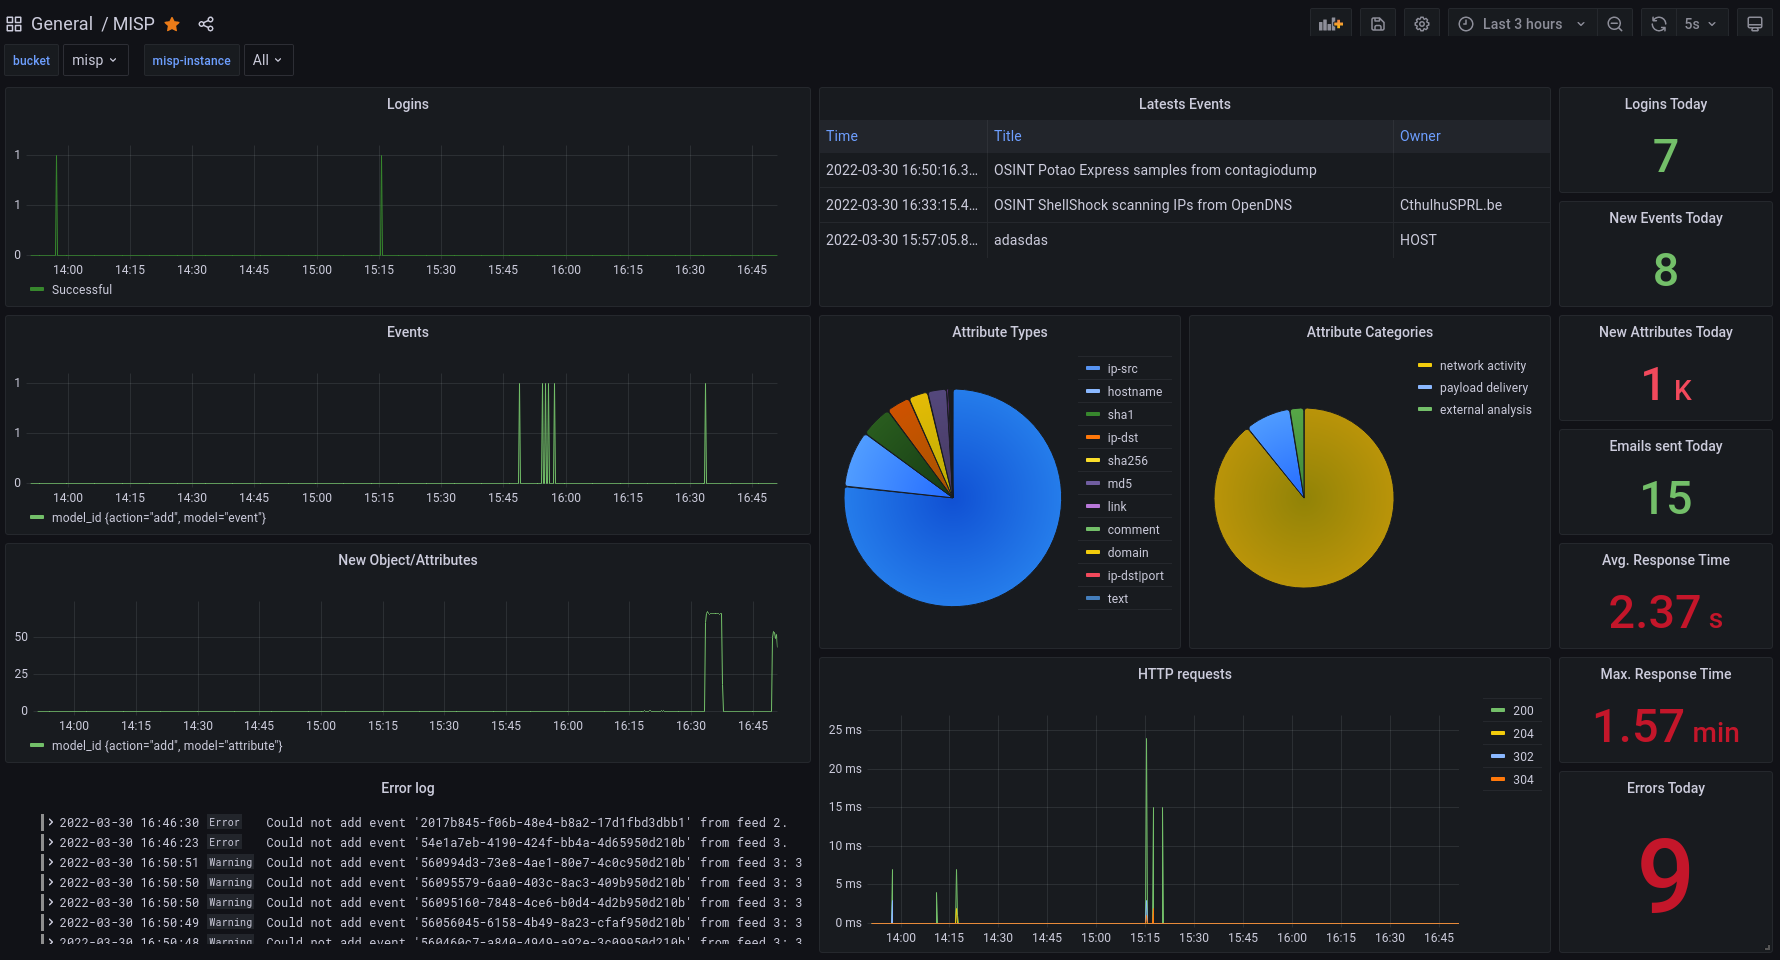
A real-time Grafana dashboard using MISP ZeroMQ message queue and InfluxDB .
Infrastructure
- InfluxDB 2.x: Time series database for storing MISP metrics
- URL: http://localhost:8086
- default user: admin
- default password: passwordpasswordpassword
- Grafana: For the UI and dashboards
- URL: http://localhost:3000
- default user: admin
- default password: passwordpasswordpassword
- push_zmq_to_influxdb.py: Subscribes to the MISP ZMQ stream and pushes data to InfluxDB
- Telegraf: Agent installed in the MISP instance for pushing logs to InfluxDB
Installation
Using containers
Using docker is the easiest way to do it and comes pre-configured with the dashboard and InfluxDB datasource.
$ cd docker
$ docker-compose up -d
NOTE: For production usage change the default credentials.
Pushing MISP metrics
After InfluxDB and Grafana are up and running, adjust .env file to your environment, and run the ZMQ subscriber script:
$ cd src/
$ pip install -r requirements.txt
$ python3 src/push_zmq_to_influxdb.py
[INFO] [2022-03-31 17:32:51,602] - Subscribed to ZMQ
[INFO] [2022-03-31 17:32:56,945] - Received message from topic: misp_json_self
[INFO] [2022-03-31 17:32:56,945] - ZMQ status pushed to InfluxDB
...
NOTE: This script must be running all times to feed InfluxDB with your MISP activity.
Pushing MISP logs
Telegraf agent is used to parse MISP logs and push them to InfluxDB, to install it follow this guide:
- https://docs.influxdata.com/telegraf/v1.21/introduction/installation/
Run the agent:
$ telegraf --config telegraf/telegraf.conf
NOTE: For the HTTP response time panels you need to extend the default Apache combined log format with the
%Doption, your Apache log configuration as follow:
LogFormat "%h %l %u %t \"%r\" %>s %O \"%{Referer}i\" \"%{User-Agent}i\" %D" combined
- More info: https://httpd.apache.org/docs/current/mod/mod_log_config.html
MISP
Go to your ZeroMQ plugin settings in MISP and set the following values:
  'ZeroMQ_enable' => true,
  'ZeroMQ_host' => '127.0.0.1',
  'ZeroMQ_port' => 50000,
  'ZeroMQ_redis_host' => 'localhost',
  'ZeroMQ_redis_port' => 6379,
  'ZeroMQ_redis_database' => '1',
  'ZeroMQ_redis_namespace' => 'mispq',
  'ZeroMQ_event_notifications_enable' => true,
  'ZeroMQ_object_notifications_enable' => true,
  'ZeroMQ_object_reference_notifications_enable' => true,
  'ZeroMQ_attribute_notifications_enable' => true,
  'ZeroMQ_sighting_notifications_enable' => true,
  'ZeroMQ_user_notifications_enable' => true,
  'ZeroMQ_organisation_notifications_enable' => true,
  'ZeroMQ_tag_notifications_enable' => true,
Monitoring multiple MISP instances
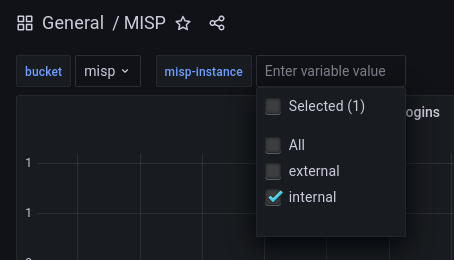
The included sample Grafana dashboard supports showing metrics from different MISP instances, for this its required that the data points coming from each instance have an associated instance tag.
Telegraf
Each instance should have running it’s own Telegraf agent, for each instance set an unique identifier global_tags telegraf.conf as follows:
Internal MISP instance
[global_tags]
  instance = "internal"
External MISP instance
[global_tags]
  instance = "external"
ZeroMQ
For each MISP instance there must be one push_zmq_to_influxdb.py script running, each connected to the corresponding ZeroMQ publisher.
Internal MISP instance
$ python3 src/push_zmq_to_influxdb.py -id=internal --url=tcp://misp.internal:50000
[INFO] [2022-04-04 14:18:24,638] - Subscribed to ZMQ
...
External MISP instance
$ python3 src/push_zmq_to_influxdb.py -id=external --url=tcp://misp.external:50000
[INFO] [2022-04-04 14:18:24,638] - Subscribed to ZMQ
...
InfluxDB v1 compatibility
If you want to add a panel using a InfluxQL query language instead of Flux, you can do so by creating a database and retention policy mapping (DBRP) for InfluxDB v1 compatibility.
cd docker/
$ docker-compose exec influxdb bash
$ influx bucket list --name=misp
ID			Name	Retention	Shard group duration	Organization ID		Schema Type
2123809cf4de9c68	misp	infinite	168h0m0s		b28ccb862d147bdd	implicit
$ influx v1 dbrp create \
  --db misp \
  --rp misp-rp \
  --bucket-id 2123809cf4de9c68 \
  -o org \
  -t tokentokentoken
ID			Database	Bucket ID		Retention Policy	Default	Organization ID
0924213ebf9ba000	misp		2123809cf4de9c68	misp-rp			true	b28ccb862d147bdd

$ influx v1 auth create \
	--read-bucket 2123809cf4de9c68 \
	--write-bucket 2123809cf4de9c68 \
	--username grafana \
  	-o org \
  	-t tokentokentoken
? Please type your password ******** (grafana1)
? Please type your password again ******** (grafana1)
ID			Description	Username	v2 User Name	v2 User ID		Permissions
092421c139dba000			grafana		admin		0923ff89a4587000	[read:orgs/b28ccb862d147bdd/buckets/2123809cf4de9c68 write:orgs/b28ccb862d147bdd/buckets/2123809cf4de9c68]
Create a new datasource in Grafana with the following parameters:
- Query Language:
InfluxQL - Custom HTTP Authorization:
Authorization:Token tokentokentoken - Database:
misp - User:
grafana - Password:
grafana1
NOTE: For production usage change the sample credentials.
Guide: https://docs.influxdata.com/influxdb/v2.0/tools/grafana/?t=InfluxQL